Equipment
On June 18th 2025 I bought a small starter kit to experiment with.
It was described as:
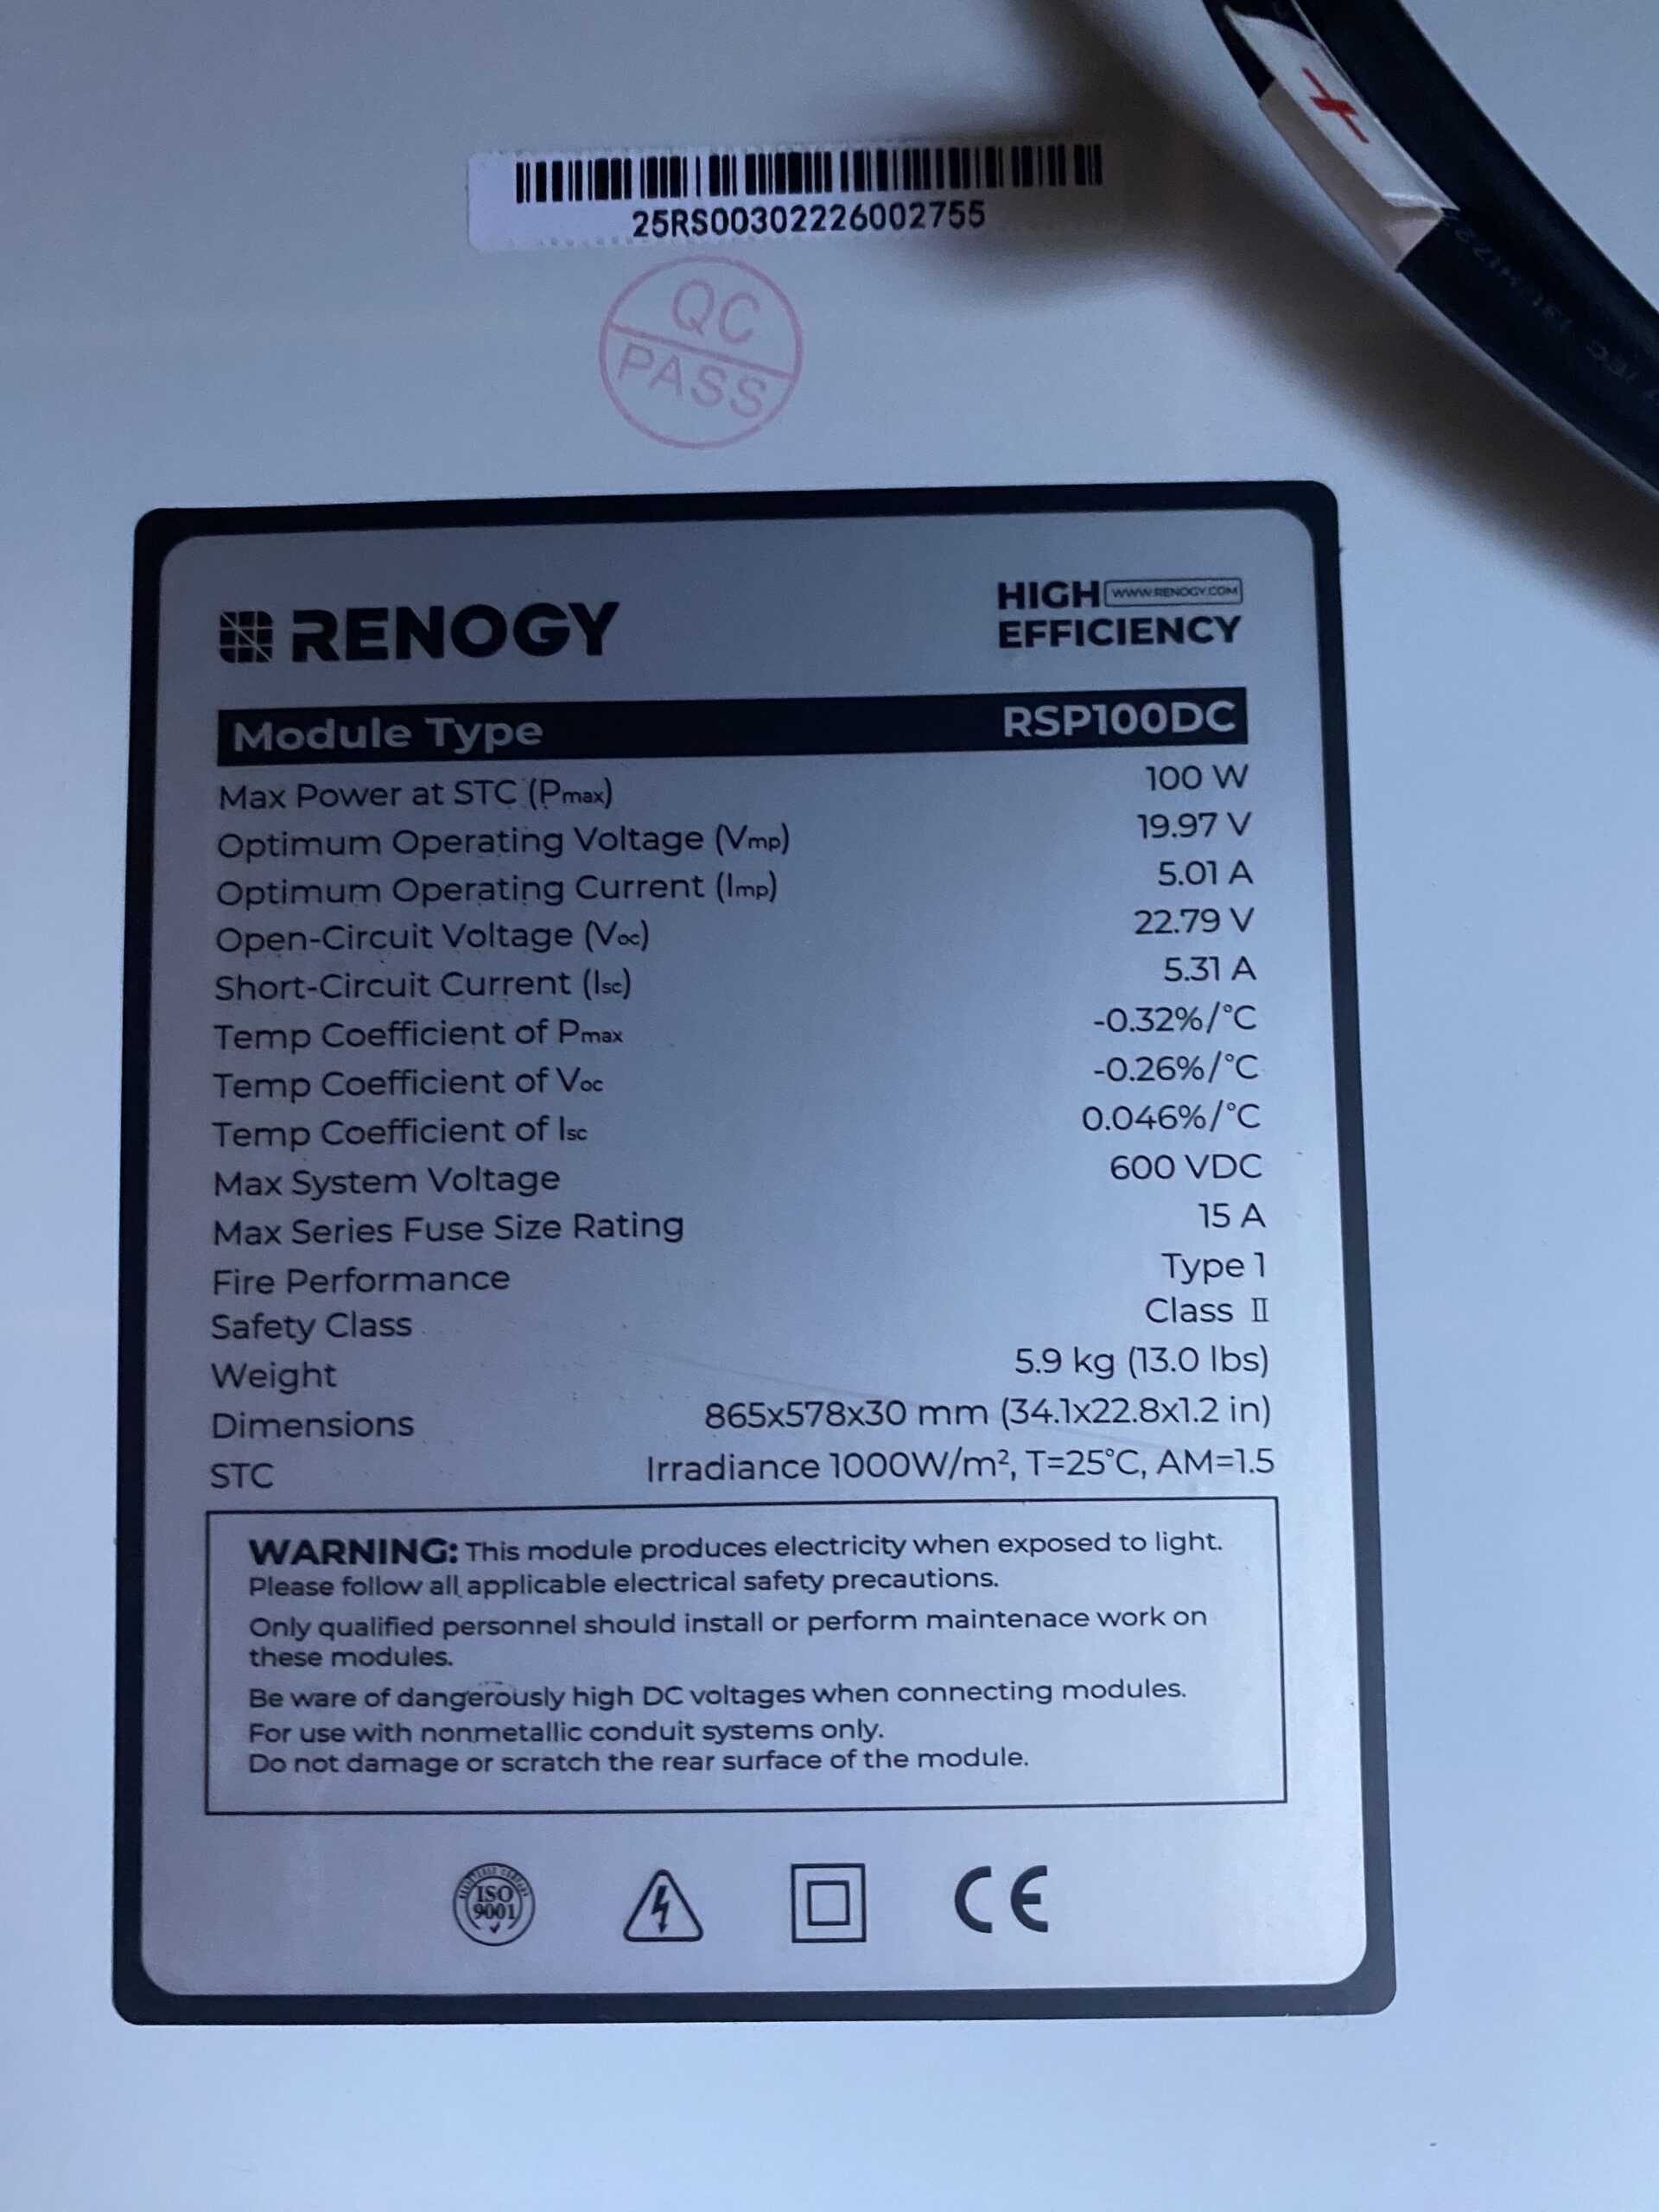
Renogy 200 Watt 12 Volt Monocrystalline Solar Panel Starter Kit with 2 Pcs 100W Solar Panel and 30A PWM Charge Controller for RV, Boats, Trailer, Camper, Marine ,Off-Grid System
Originally I hooked it up to a 12 volt riding lawnmower battery and used it to power a ICOM 7300 Amatuer radio and it worked fine and I always had power to listen in the evenings when I had time.
On 12 February 2026 I ordered this kit to experiment with.
It was described as:
Renogy 200 Watt 12V Complete Solar Panel Starter Kit: 2pcs 100W Solar Panel + 30A Charge Controller + 100Ah Lithium Battery + 600W Premium Solar Inverter for RV Off Grid with Battery and Inverter
As you can see, I now had 2 more solar panels, another controller and a inverter and battery.
I have been slowly purchasing a fuse and a breaker to shut off the power from the solar panels.
It was described as:
Solar Panel Disconnect Switch 1000V 30A PV Disconnect Switch Outdoor Miniature Circuit Breaker IP65 for Solar PV Homes Battery (1000V 30 Amp)
Now all I needed was a fuse terminal:
And a fuse:
I now have all the pieces and will be putting it together soon with the purpose of running a small 4.4 refrigerator that I brought from lowes a year or two ago.
If that works ok, I’m looking at building a similar system using Victron components to see how they compare against each other as I have an additional refrigerator and a small chest type freezer that I want to take offline first.
No idea if it will work, so stay tuned.
Lets measure it
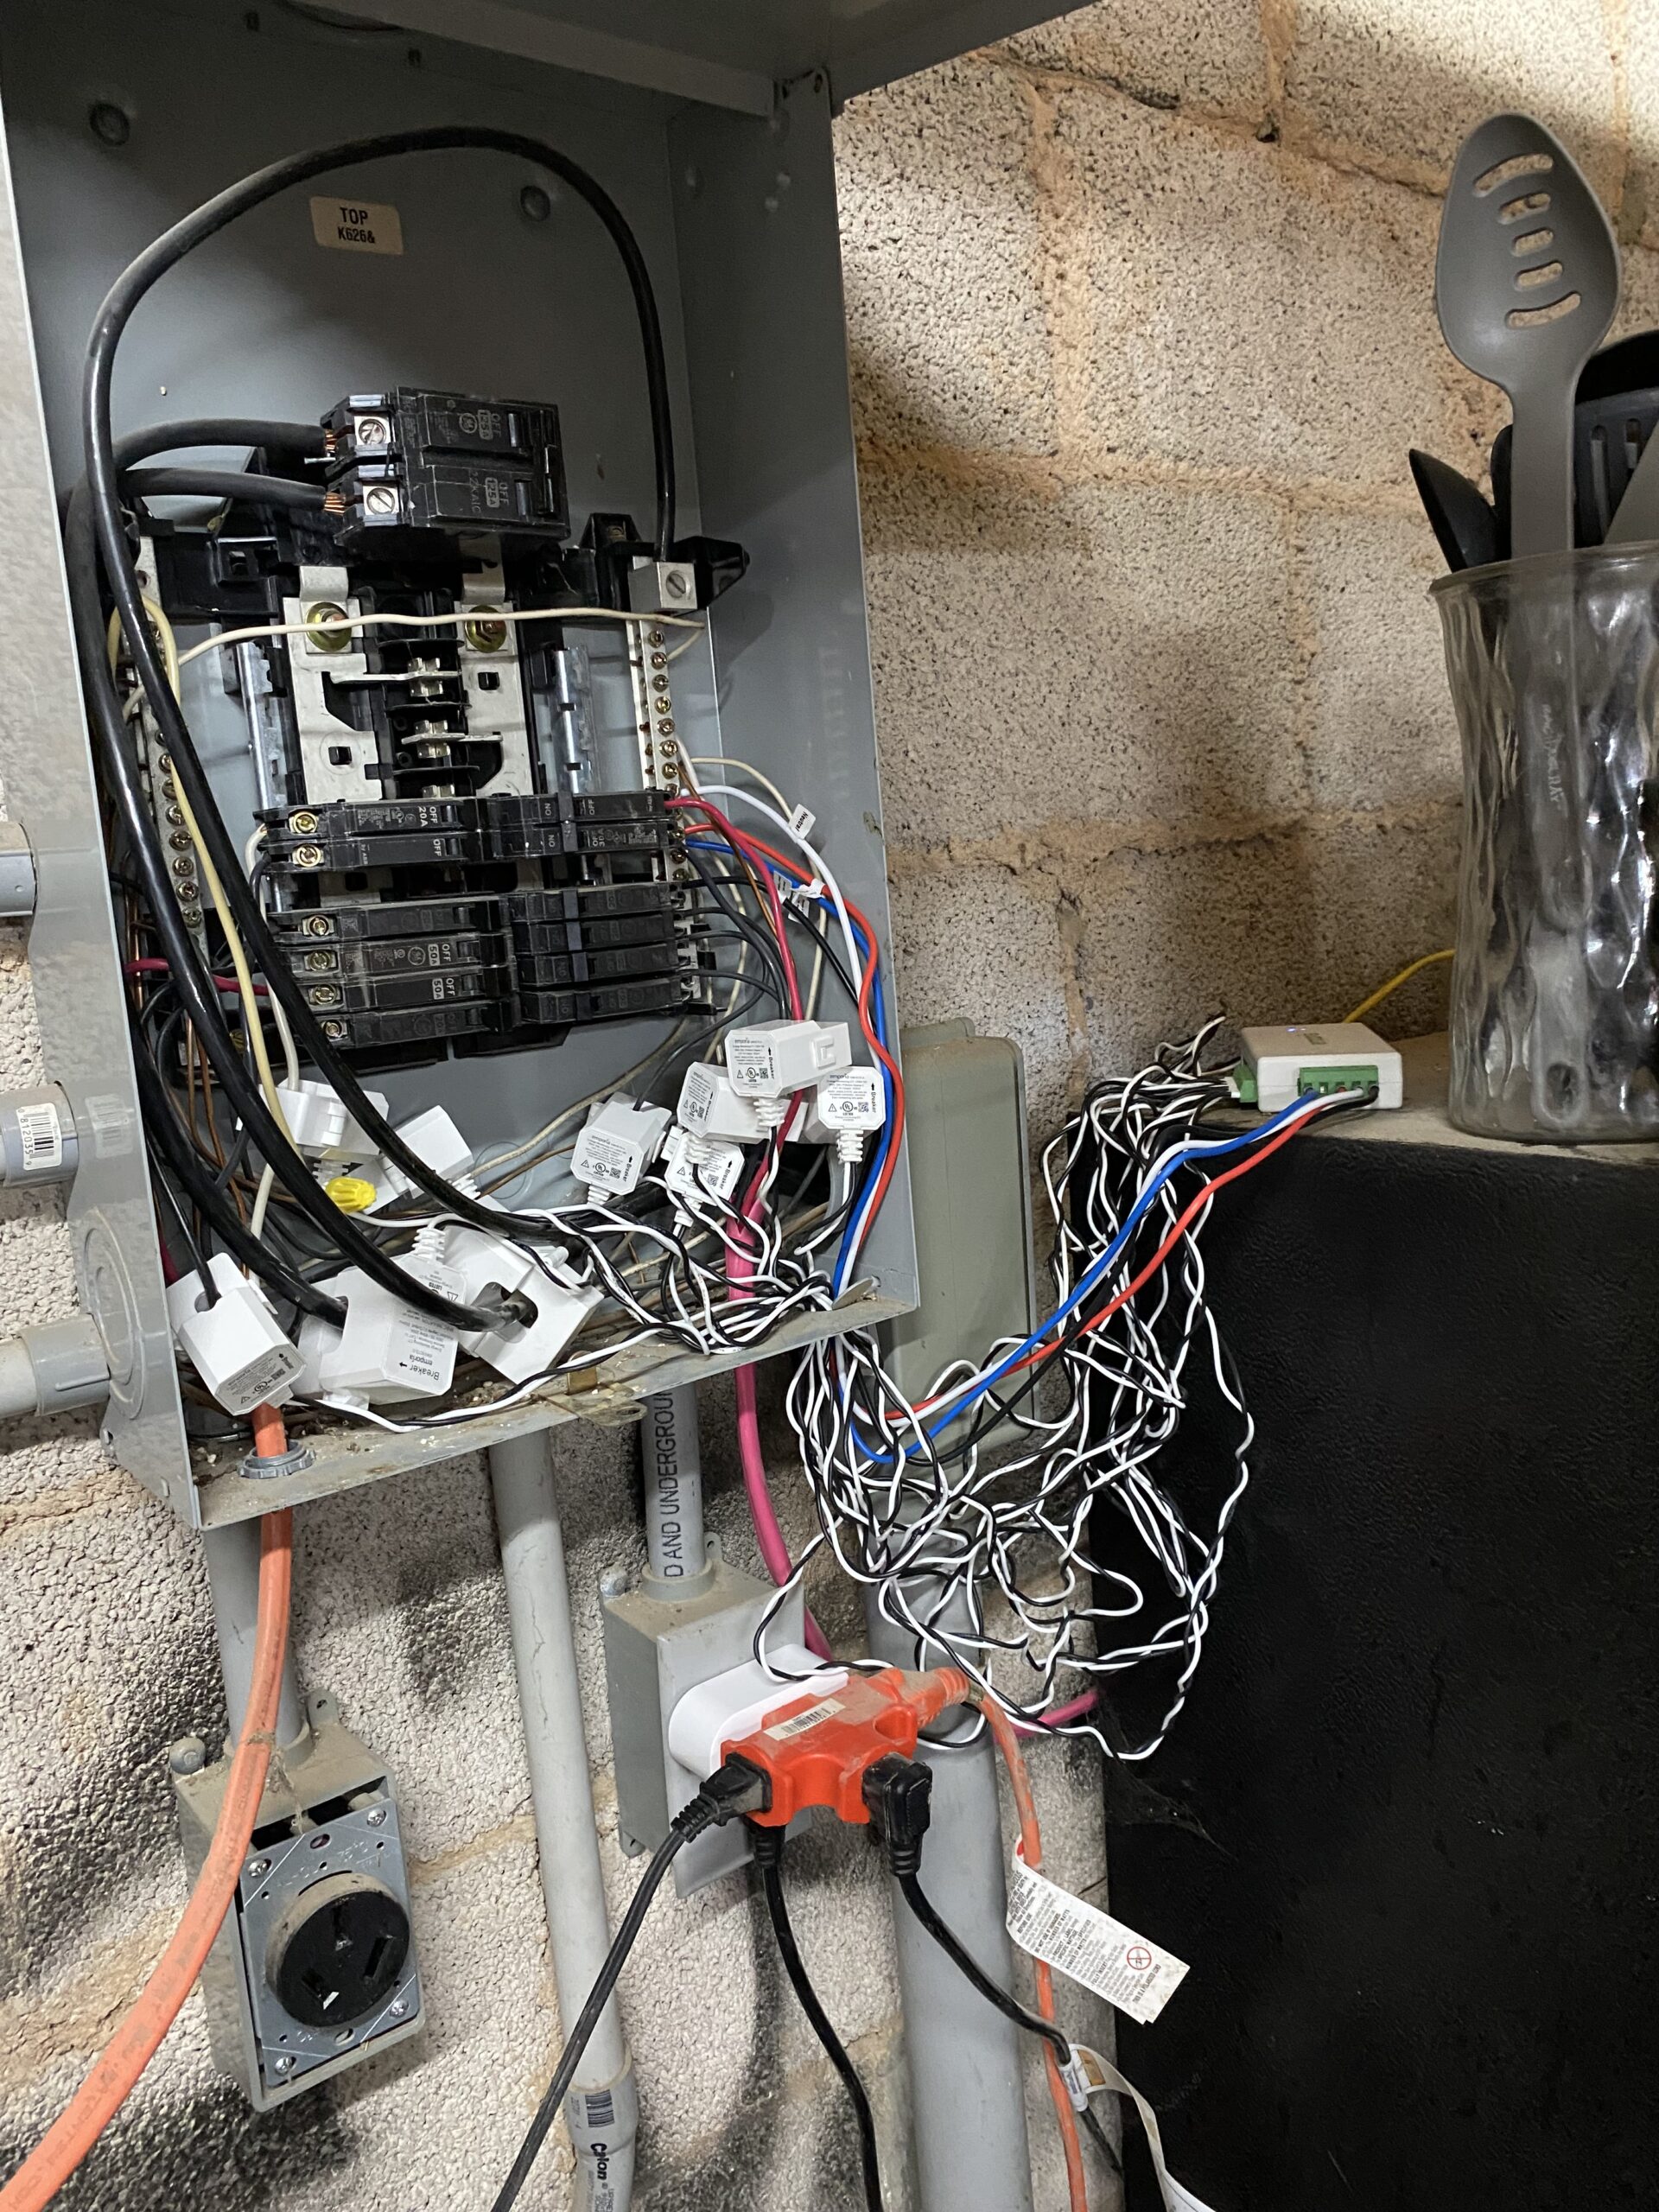
After some research, I settled on this product and I’m impressed with it.
Because my electrical box wasn’t big enough, I snaked the cables through a hole and hooked it up outside.
There were a couple of cables I couldn’t snap the equipment around, but they were 220 volts, so I hooked it up on one side and used the times 2 multiplier.
I do have plans to clean up those wires so I can put a clamp around every one and label them properly.
How Big?
Being new at this, I asked google how much of a system I would need to build and this is what the AI spit out.
As you can see, this is not possible with my finances, so I will pursue a zoned approach.
To replace your current electricity usage entirely off-grid, you would need a solar array of approximately 45 to 55 kW and a massive battery bank of 300 to 500 kWh.
Sizing an off-grid system is different from grid-tied solar because you must size for your peak monthly usage (4,676 kWh) rather than your annual average. In a grid-tied system, you can “bank” excess summer energy for winter use; off-grid, you must be able to generate and store enough power even during your highest demand months and shortest winter days. [1, 2, 3, 4]
Estimated System Requirements
Based on your peak usage of 4,676 kWh per month:
- Solar Array Size: Approximately 45–55 kW.
- This would require roughly 110 to 140 panels (assuming modern
400W solar panels
).
- This setup requires roughly 2,000 to 2,500 square feet of unobstructed roof or ground space.
- This would require roughly 110 to 140 panels (assuming modern
- Battery Storage: Roughly 300–500 kWh.
- Off-grid systems typically require enough storage for 2–3 days of “autonomy” to cover cloudy or rainy periods without sunlight.
- For your peak daily usage of ~155 kWh, a 465 kWh battery bank (3 days of storage) is recommended to avoid deep-discharging and damaging batteries. [2, 3, 5, 6, 7, 8, 9, 10, 11]
Key Considerations for Off-Grid Living
- Peak Sun Hours: Calculations depend heavily on your location. Texas averages about 4.5 to 5.5 peak sun hours per day, but this drops significantly in winter. Sizing for the “worst” month (lowest sun, highest use) ensures you never run out of power.
- Inefficiency Buffer: Off-grid systems lose roughly 20–25% of their energy to inverter conversion, wire resistance, and battery charging losses.
- Backup Generator: Almost all total off-grid systems of this size include a backup generator. It is often more cost-effective to have a smaller solar array and run a generator during a week of rain than to build a massive solar system that is only fully utilized 5% of the year.
- Energy Audit: 4,600+ kWh per month is over four times the average U.S. household usage. Before going off-grid, it is highly recommended to perform an Energy Audit to reduce your load (e.g., switching to heat pumps or improving insulation), as every 1 kWh saved can save thousands in equipment costs. [1, 3, 8, 10, 12, 13, 14]
AI responses may include mistakes.
Why?
Why am I interested in going offgrid even though I live in the city?
My income is $1,419 per month on social security.
My electric bill averages $650 per month because I’m on average billing because of the wild swings as shown in the electric.
This is not sustainable and I expect the bill to grow substantially with what is happening in the global economy.
I asked claude to help me analyze my electic bill for the last year and this is what he came up with.
Here’s what your actual electricity usage would have cost each month without the Average Monthly Billing program, based on the “Current Charges” on each bill:
| Billing Period | kWh Used | Actual Charges |
|---|---|---|
| Apr 22 – May 21, 2025 | 2,352 | $323.08 |
| May 21 – Jun 20, 2025 | 3,136 | $429.68 |
| Jun 20 – Jul 22, 2025 | 3,164 | $546.35 |
| Jul 22 – Aug 20, 2025 | 3,123 | $544.25 |
| Aug 20 – Sep 19, 2025 | 2,860 | $517.93 |
| Sep 19 – Oct 20, 2025 | 2,718 | $492.13 |
| Oct 20 – Nov 18, 2025 | 2,411 | $436.91 |
| Nov 18 – Dec 19, 2025 | 3,873 | $699.88 |
| Dec 19, 2025 – Jan 22, 2026 | 4,676 | $844.31 |
| Jan 22 – Feb 20, 2026 | 4,366 | $788.55 |
| Feb 20 – Mar 23, 2026 | 2,191 | $391.71 |
| Mar 23 – Apr 22, 2026 | 1,757 | $314.76 |
A few things stand out: your winter months (Dec–Feb) are by far your heaviest usage, with the Jan 2026 period hitting 4,676 kWh and $844. Spring is your lowest usage period. The Average Monthly Billing plan smooths out those peaks by spreading the cost more evenly, which is why you’ve been paying roughly $536–$603/month instead of swinging between ~$315 and ~$844.